In order to provide a little more context in/around the Market Analysis Service, we’ve compiled the content below. This will walk you through the different components as well as examples of different network strength positions in this sample analysis.
Components
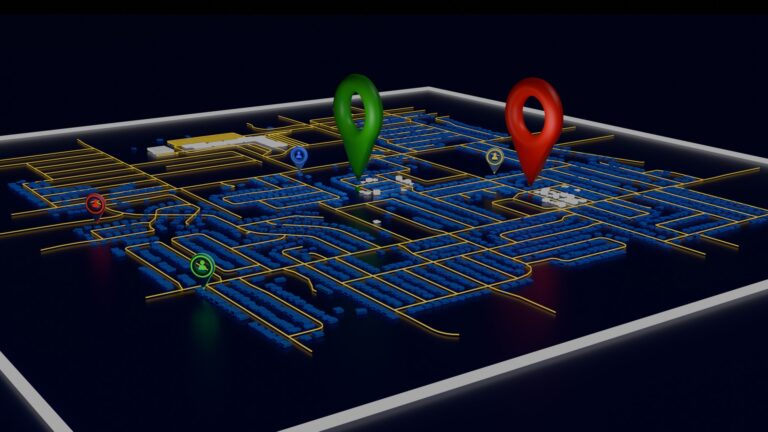
As you can see the picture to the left is a close up view of a micro market.
Competitors: The large green and red site marker represent competitors.
Residential Housing: These are represented by the blue buildings.
Customer Markers: There are four glowing markers representing distinct segments depicted in the chart on the left. Red, green, blue and yellow.
Additional Icons: There are golden roads and white commercial buildings.
Quantify Network Strength
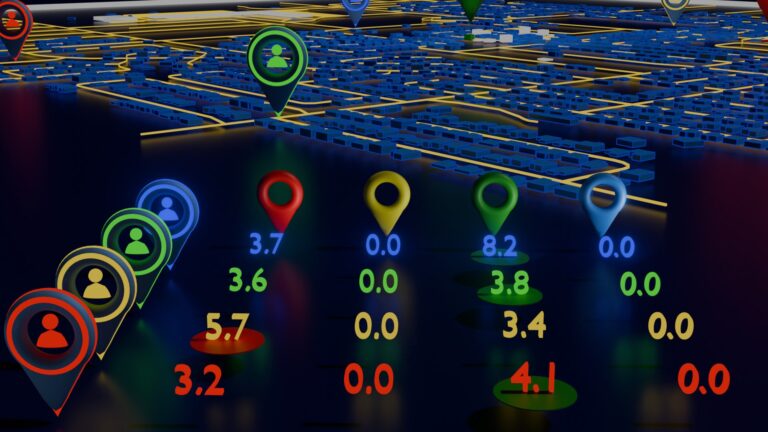
For each of the customer markers listed above we have computed a competitive intensity metric to quantify how convenient each competitor location is to a given customer.
On the chart on the right you can see that within this particular micro-market, for the selected four customers, the Green competitor has the best market position for three of the four Customers located in this market.
The numbers here are illustrative. The “higher” the number the better positioned the competitor is in the market place. Lower numbers suggest a much more competitive landscape.
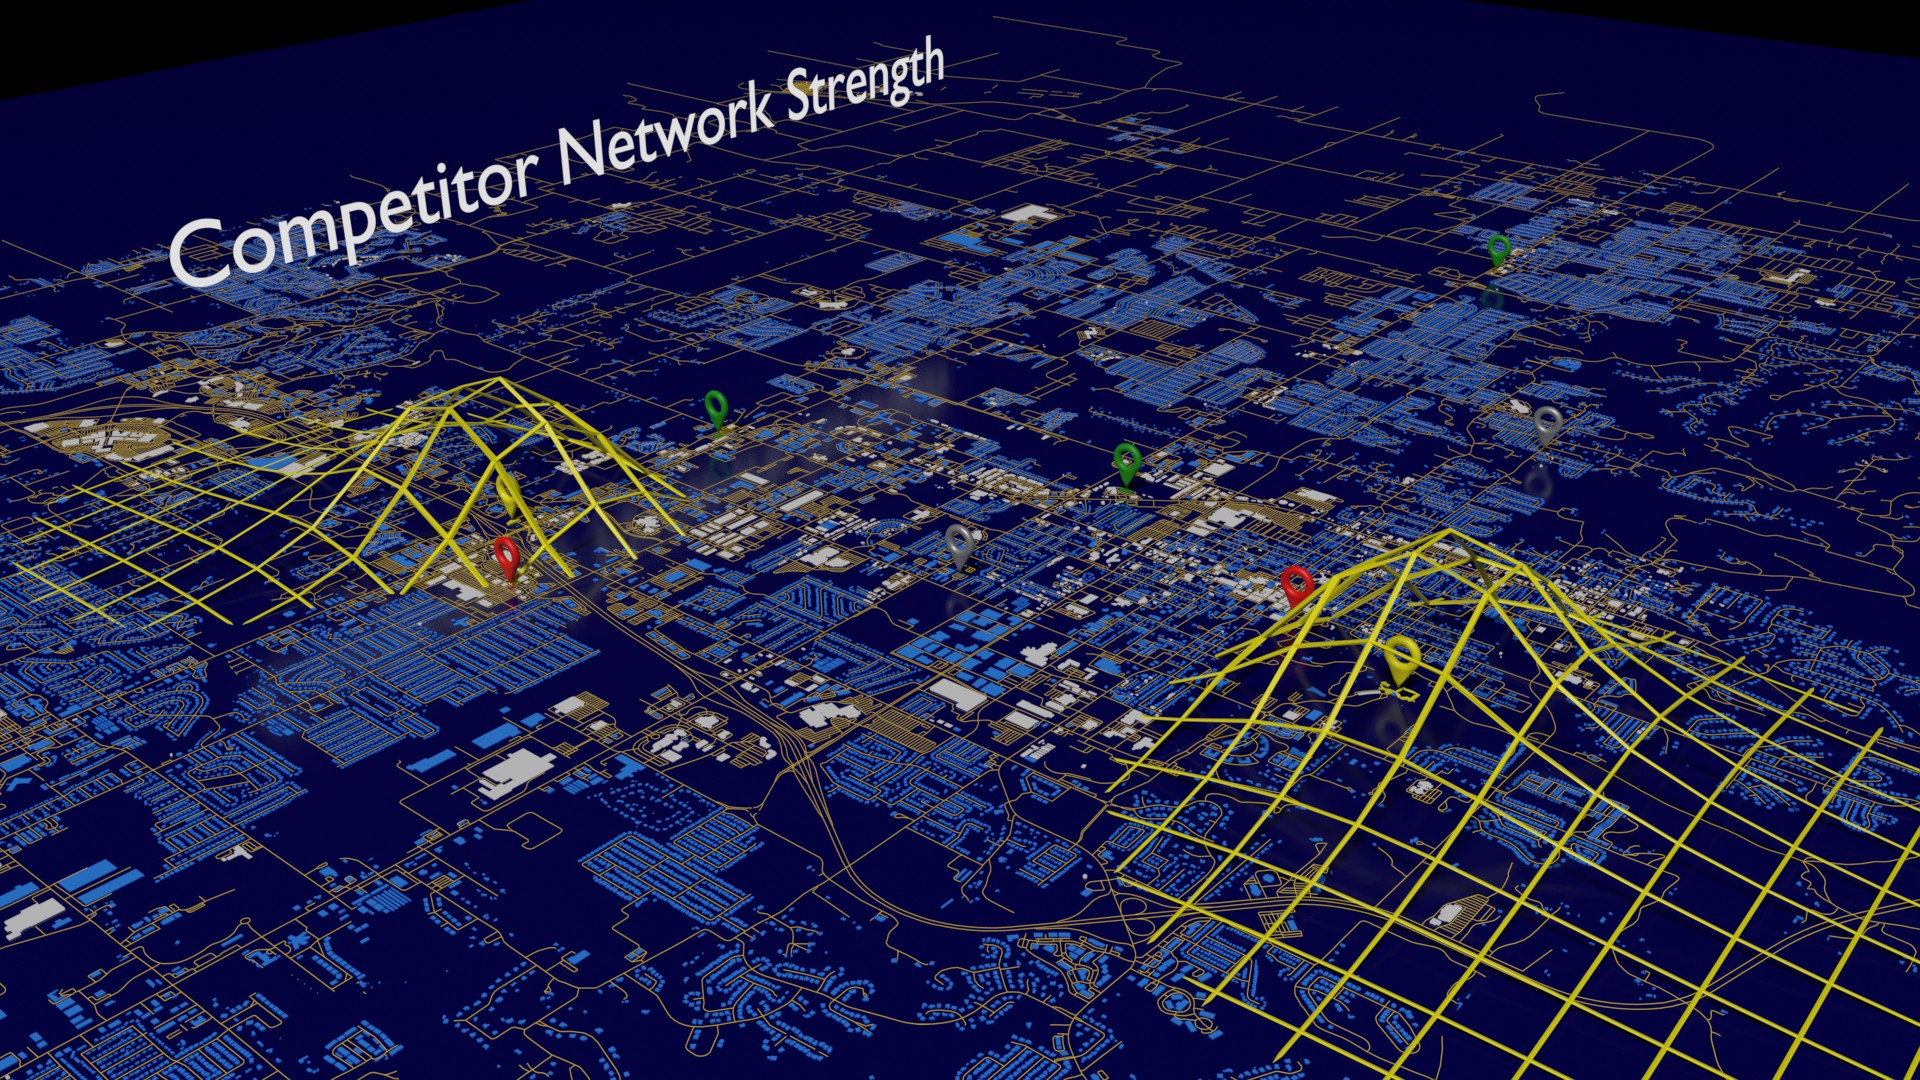
Full Micro-Market View
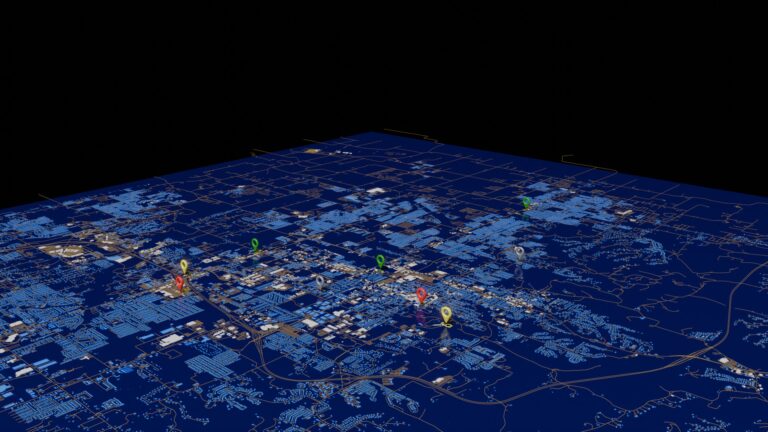
The market analysis above is small and for illustrative purposes only. The picture to the left does a better job of depicting the size of a given micro-market analysis. This is a 20km x 20km area where we’ve labeled some competitor locations and analyzed the strength of each competitor store network. It is as if you are in an airplane circling the geography to get a full market view of where all the physical assets are placed. You can see the positions of your stores, your competitors and the customers that reside within the geography.
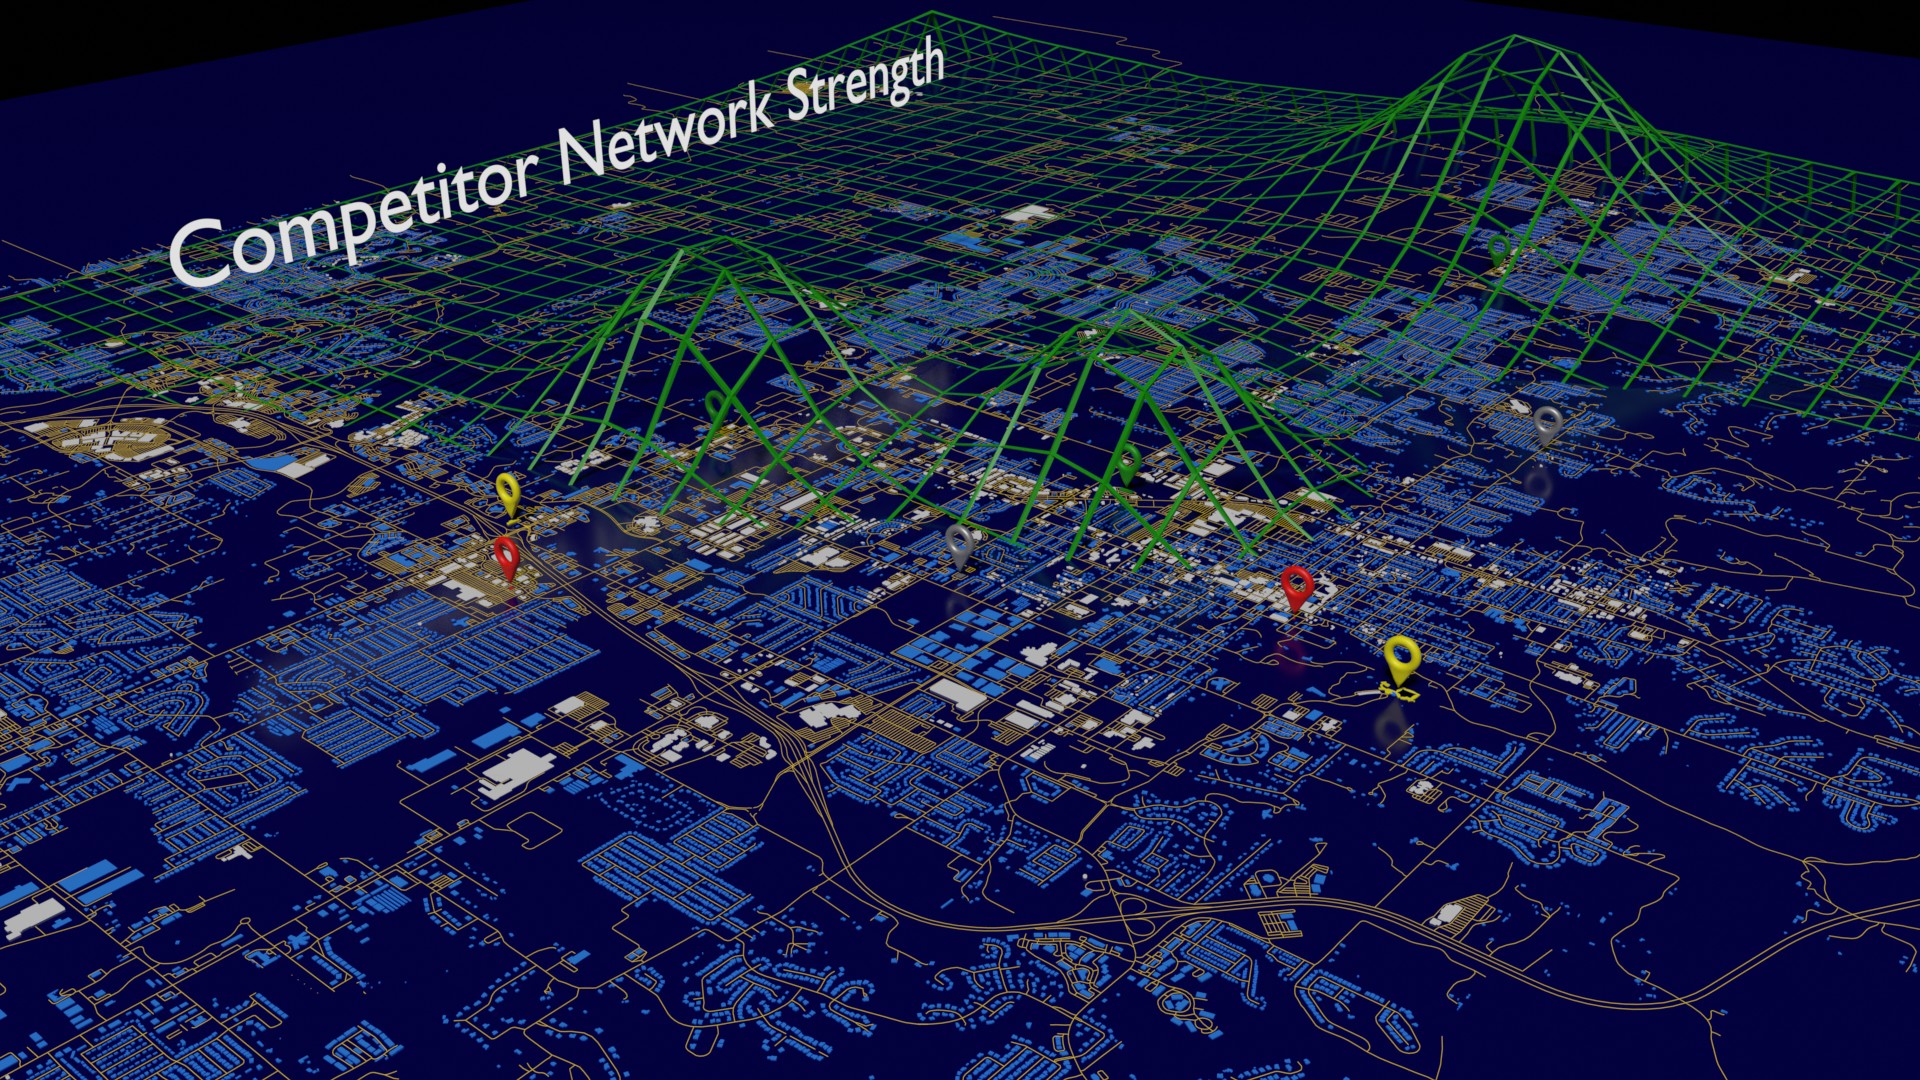
Competitor Network Strength
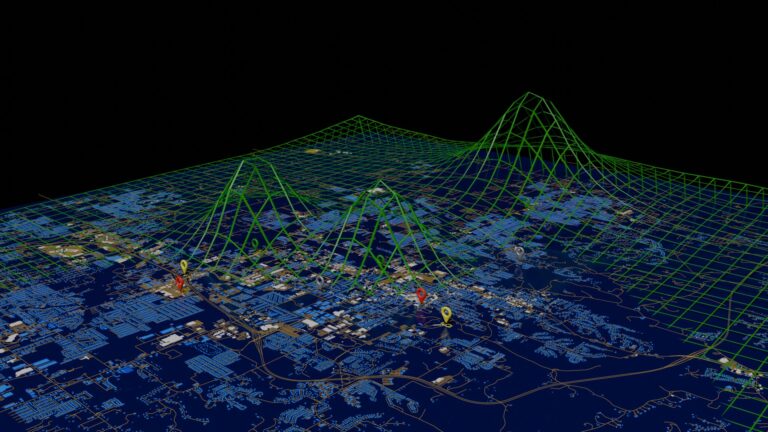
In the picture to the left you can see areas where the competitor identified by the green marker has a strong convenience/proximity position relative to other competitors in the market place. The higher the green mesh, the more convenient the “Green” Competitor is to the nearby residents. Accordingly other competitors are materially less convenient where the green mesh is highest. Where there is no green mesh visible, the convenience of the Green competitor is diminishing and other competitors are better positioned from a convenience point of view.
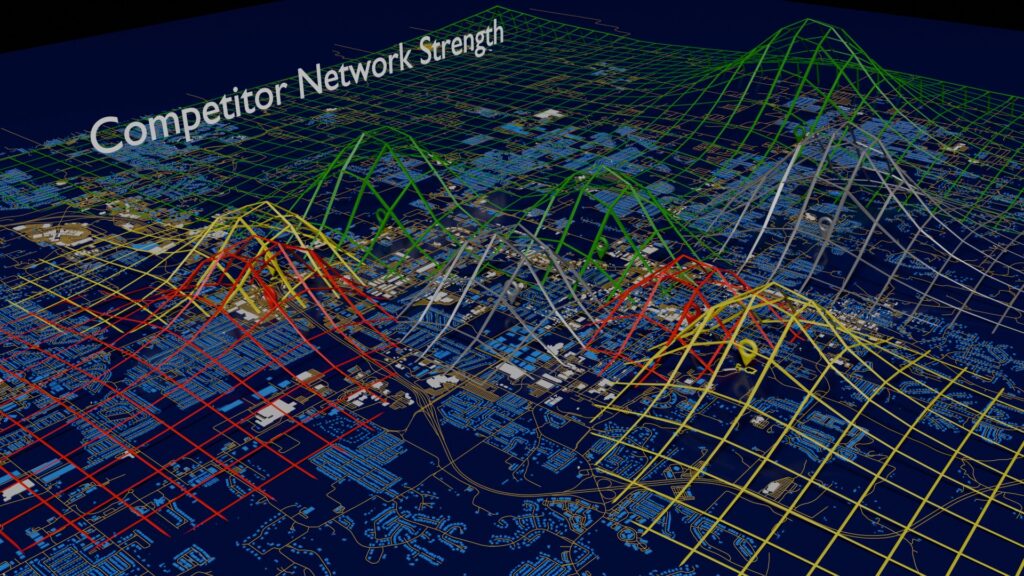
Each Competitor's Network Strength
Red Competitor
Two retail sites located in the upper front
Yellow Competitor
Two retail sites split by the red competitor
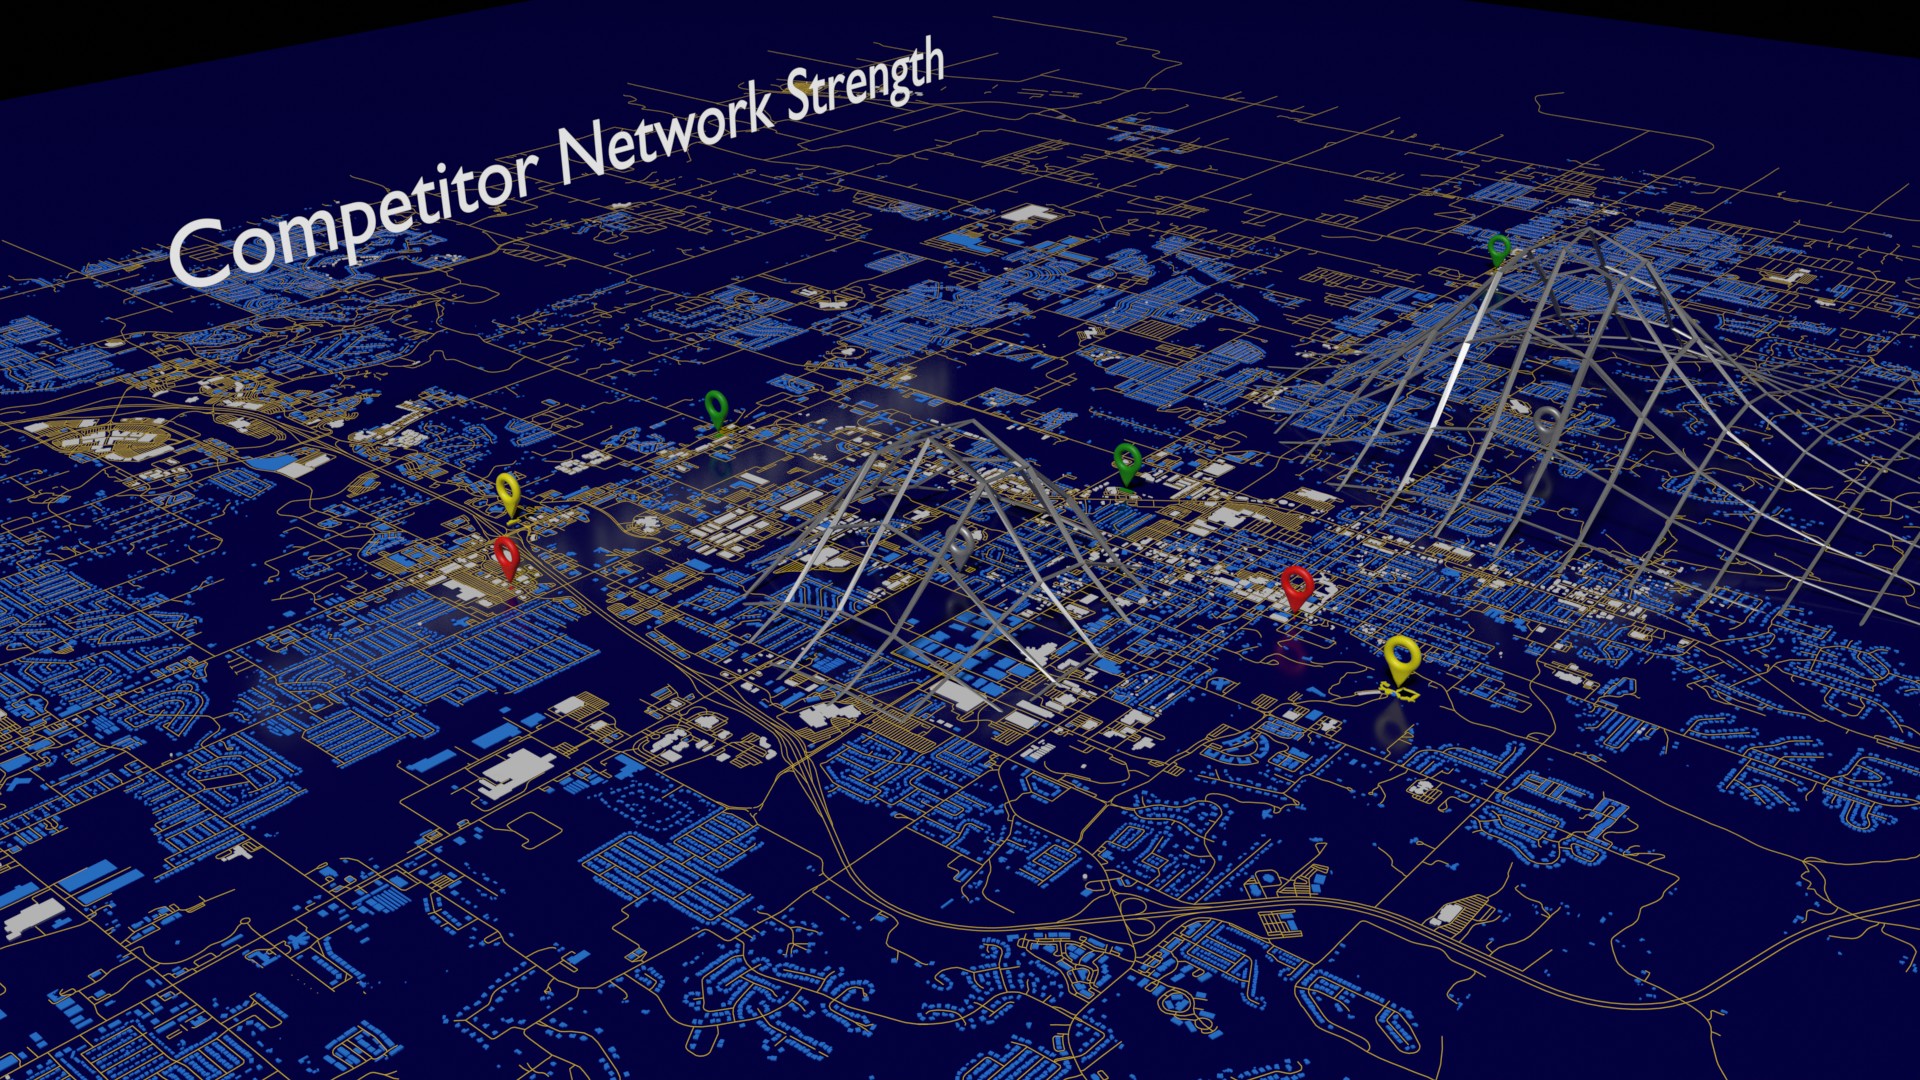
Gray Competitor
Two sites one of which is flanked on either side by the green competitor.
Green Competitor
Three sites and has a strong position in the back half of the geography.
Structure of Virtual Markets
Roads
Understand the Travel Times and Distance your Customers take to your site and your competitors.
Commercial Buildings
Identify areas for Commercial Property Expansion and potential site selection.
Residential Locations
Virtual Environments that reflect the different neighborhoods and homes where you customers live.
Market Competitors
Identify your retail locations and your competitor positions in the market place.